


by Joe Kleiman
The 2018 TEA/AECOM Theme Index and Museum index was released on May 22. InPark’s Joe Kleiman explores some of the trends and changes within the industry that led to attendance increases and decreases at the world’s most-visited theme parks, waterparks and museums.
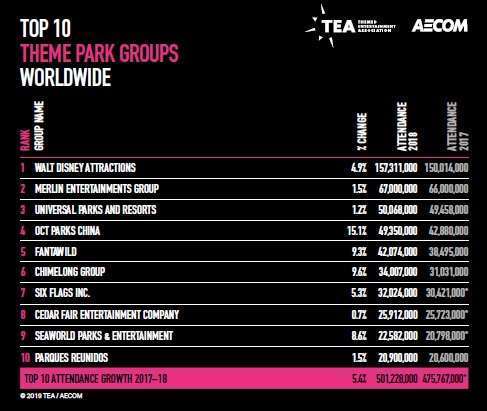
According to the figures in the 2018 TEA/AECOM Theme Index, the ranking of the top 10 theme park groups (see above chart) remains unchanged from 2017; it is also rather apparent that each of these operators saw an increase in attendance during that time period. Major increases in attendance were found with those parks benefiting from changes in marketing strategy, the expansion of integrated resorts, and improvements in transportation infrastructure. Parks in South Korea suffered due to a diplomatic issue with China resulting in a reduction of visitors from the Chinese Mainland, while Dubai parks find themselves in competitive numbers with local attractions and waterparks due to the accelerated attraction development model in the region.
The regional park model
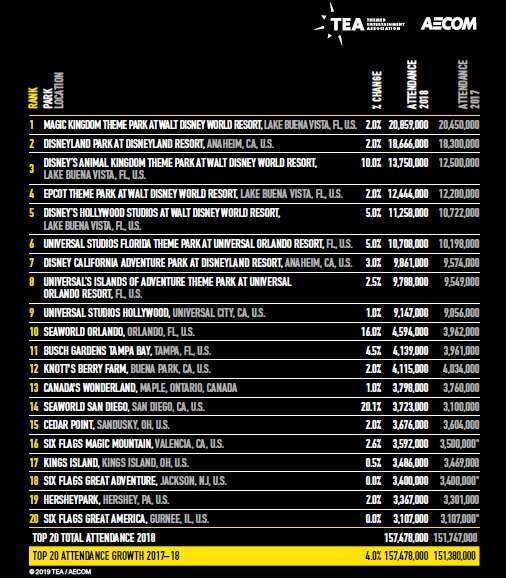
One of the biggest turnarounds revealed is a dramatic increase in attendance at SeaWorld’s flagship parks in Orlando (+16%) and San Diego (+20.1%), reversing a series of declines that began in 2013 following the release of a critical documentary film . Brian Sands and Kathleen LaClair write in the report: “SeaWorld’s good performance is creditable to investments in new rides and programming and leveraging the Sesame Street IP (photo at top), in addition to working actively to change the conversation about the parks — internally and externally — and making other positive changes.”
In addition to adding a new ride or attraction each year, SeaWorld has increased the number of festivals and events at each park, with new ones taking place year-round at its Orlando property. As reported by InPark in 2017, this is a strategy often used by park operators to increase season pass sales and entice return visits for passholders, resulting in an increased per cap for food & beverage and retail sales.
Fully integrated resorts
We reported last year following the release of the 2017 edition of the Theme Index that stronger attendance performances resulted from those parks within fully integrated resorts (indicating on-premises accommodations, and often a second gate or retail/dining district). The 2018 Theme Index shows that this trend is effective and continuing. Of the 25 top-attended parks worldwide, only three – Universal Studios Japan, Universal Studios Hollywood, and Lotte World – do not have on-premises lodging, though they do partner with adjacent hotels, and offer other amenities such as non-gated retail/dining districts and aquariums.
Not all of the worldwide top five saw significant increases, however. South Korea’s Everland dropped 7.3% and Lotte World 11.2%, primarily due to the a continuing political skirmish between China and South Korea over the latter’s deployment of an American-supplied anti-missile network. As part of its strategy, the Chinese government banned group tours to South Korea. Although this ban was partially lifted at the beginning of this year, Properties owned by Lotte, a South Korean multinational conglomerate, remain off limits to Chinese tourists due to the Korean company’s provision of the land for the anti-missile system . This includes Lotte World in Seoul. The effect of politics on Chinese tourism abroad was examined in InPark issue 75 last year.
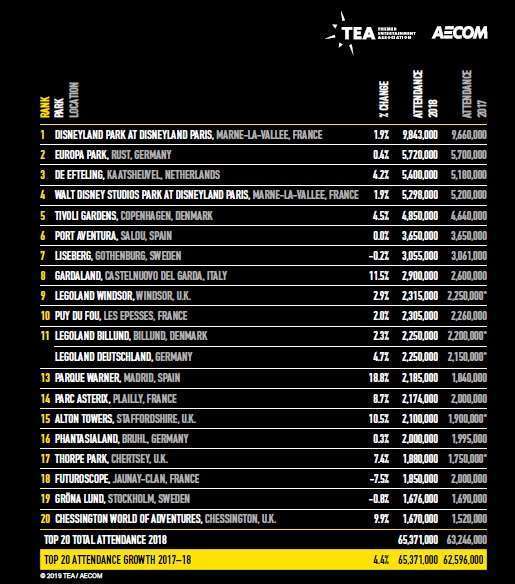
In Europe, Europa-Park, which experienced a fire that destroyed a portion of the park in late May, saw an increase of only 0.4% – but nevertheless an increase in a challenging year for the operator – while other key European parks, Efteling and Tivoli, saw a 4.2% and 4.5% increase respectively.
China and Dubai
The biggest attendance increases in the world’s top 25 theme parks took place at two Chimelong parks – Chimelong Paradise in Guangzhou (+11.9%) and Chimelong Ocean Kingdom in Zhuhai (+10.6%). AECOM’s Chris Yoshii and Beth Chang partly credit increased attendance at Ocean Kingdom to the opening of the Hong Kong-Macau-Zhuhai bridge. The bridge also helped fuel an 8% increase at Hong Kong Disneyland and a stabilization of attendance at Ocean Kingdom, as did a new high-speed rail line linking Hong Kong to Mainland China.
We looked further into how this new transportation infrastructure has helped boost tourism in the region and found that the new bridge has had a significant impact on visitation to Macau as well as Zhuhai and Hong Kong. According to data from the Government of Macao Statistics and Census Service, overnight stays in Macau increased 1.25 million and same-day visitation increased 1.9 million from 2017 to 2018. As the rail line opened in late September and the bridge in late October, we will need to wait until next year’s Theme Index to get a better evaluation of how these projects affect park attendance over the course of a full year.
Reporting on parks in the Middle East for the 2018 Theme Index, AECOM’s Jodie Lock writes: “We see strengthening results from the newer properties such as IMG Worlds of Adventure and the multi-gate Dubai Parks and Resorts as well as the more established Ferrari World Abu Dhabi, and various water parks.”
None of the Middle East parks yet has sufficient attendance to land on the TEA/AECOM chart of top parks in the EMEA region. However, there are some publicly available figures. Dubai Parks and Resorts operator DXB Entertainments, as a publicly traded company, released an attendance figure of 2.784 million for 2018. This cumulative figure includes attendance for MOTIONGATE Dubai, Bollywood Parks Dubai, and LEGOLAND Dubai and its attached waterpark.
There is an indication that Dubai Parks and Resorts and IMG Worlds of Adventure may not be competing for market share with one another, nor with other UAE theme parks, so much as with local attractions and waterparks. Supporting information for this can be found in the 2018 Theme Index: In the special feature on Observation Experiences there are figures for the observation floor on the Burj Khalifa, with 2 million visitors; and the EMEA water parks table shows Aquaventure Water Park at Atlantis The Palm, with 1.4 million . Weighed against the 2.784 million figure for DXB, these attractions come within a competitive attendance range to the local parks.
Part of this skew in attendance may be due to the growth pattern of Dubai’s attractions industry. According to Jodie Lock: “At present, the number of visitor attractions in Dubai is large, relative to the size of its market. It is comparable to emerging markets in Asia, such as China, in that it has grown its leisure sector at a very rapid pace, but without the equivalent of China’s vast, resident population. This is a more high-risk process than the slower, organic growth that typified mature Western markets such as Orlando.”
Museums: government shutdowns and strong social media
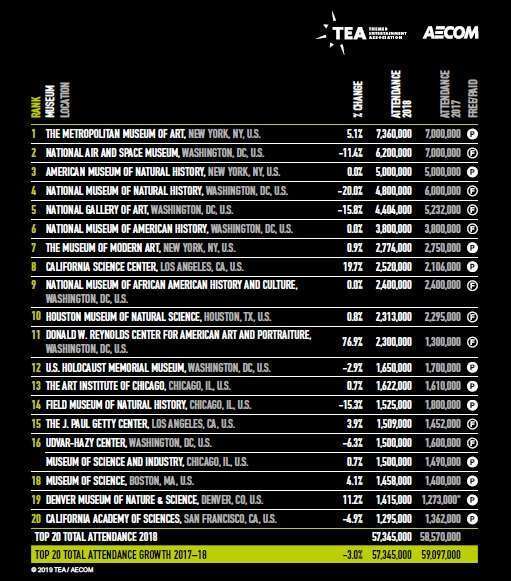
While most museums saw a significant increase (most noticeably the California Science Center in Los Angeles, which celebrated its 20th anniversary with a special exhibition of the treasures of Tutankhamen, resulting in a 19.7% increase), federally operated museums in Washington DC did not fare well, with most Smithsonian museums and the National Holocaust Museum losing attendance. Although the government shutdown started December 22, the Smithsonian used existing funds to remain open through the end of the year. However, due to the continuation of the shutdown into 2019, government operated museums did not reopen until the last three days of January, which will have a significant impact on attendance numbers for 2019. Not all Smithsonian museums suffered losses in 2018. The National Museum of African American History and Culture (NMAAHC) held steady on attendance, while the National Portrait Gallery saw an increase of 76.9% – a million additional visitors – with the unveiling of the official portraits of President Barack Obama and First Lady Michelle Obama.
In Europe, the Auschwitz-Birkenau Museum in Poland broke into the top 20 EMEA museums with 2.152 million visitors, a significant achievement that is, per AECOM’s museum specialist Linda Cheu, “not an easy feat in this mature market.” Linda also writes that “Its inaugural appearance in the TEA/AECOM Museum Index is attributed to broad awareness created through social media platforms.”
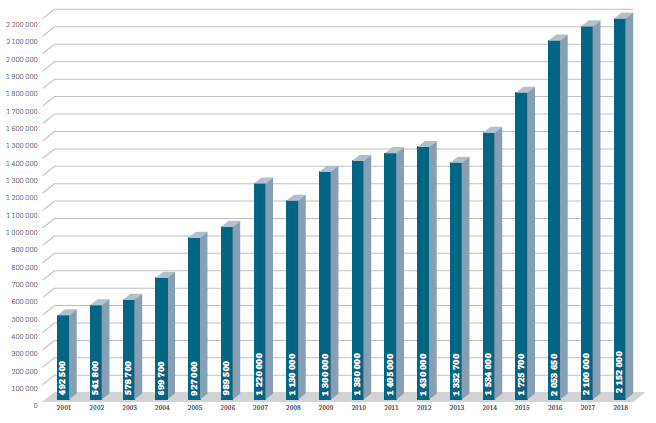
We explored the Auschwitz Birkenau Museum’s annual report to learn more. According to the museum’s published figures, 275,000 people follow it on Twitter and another 277,000 on Facebook, and the museum’s website received 27 million page views in 2018. This dedication to the use of social media and the internet is one part of an extensive plan that has transformed a memorial on the grounds of a Nazi concentration camp into a leading research center, archive, and museum about the Holocaust, resulting in sustained attendance growth over the past 18 years (see chart from museum above). The museum continues to expand with a new exhibit center and new education center in the works.


