


 by Joe Kleiman, InPark News Editor
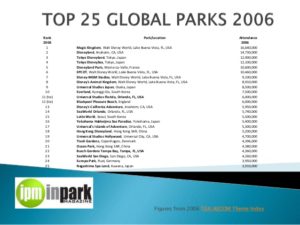
InPark has collected each of the Top 25 Global Attendance lists from the TEA/AECOM Theme Indexes for 2006-2015, spanning the report’s 10 years of publication. For all lists, we have added the prior year’s standing and for the 2006-2010 lists, we have also added the prior year’s attendance and percentage of change.
New lands = attendance growth
When comparing one year after another, trends begin to present themselves. For one, huge new lands result in huge increases in attendance. The 2011 expansion of Ocean Park Hong Kong increased attendance by 36.4% while the same year saw Universal Islands of Adventure outrank Universal Studios Florida with the first full year of operation for The Wizarding World of Harry Potter, resulting in an attendance increase of 29% over the prior year. The opening of Cars Land and Buena Vista Street at Disney California Adventure in 2012 resulted in a 22.6% increase in attendance. Both Universal Studios Japan and Universal Studios Florida saw a 17% spike in attendance in 2014, due in large part to new Harry Potter themed lands at each park.
Market power in Asia and Europe
Second, throughout the 10-year existence of the TEA/AECOM Theme Index, one thing has remained consistent – outside of Disney and Universal parks, independent operations in Japan (Nagashima Spa Land, Yokohama Sea Paradise), Hong Kong (Ocean Park), and South Korea (Everland, Lotte World) have continually remained on the top 25 list, highlighting a strong theme park market in Asia.
Since 2012, parks in Mainland China have joined the list, bolstered by the country’s growing middle class. Of special note is Chimelong Ocean Kingdom, which joined the list with attendance of 5,504,000 in 2014 and jumped from the 20th spot on the list to the 13th in 2015, with attendance of 7,486,000, a 36% increase. It should be noted that the park did not open officially until March 29, 2014, resulting in a partial year figure for its first year of operation. Consistent strong numbers for leading European parks, such as Europa-Park and Tivoli Gardens also show the continued global scale and growth of the industry, particularly with regional players.
Click here to download InPark’s PowerPoint slideshow with year-by-year figures
Click here to view it on SlideShare


